Maybe this will help you with your error. Birth rates are not going to matter here. Do you understand? Incomes are not inherited.
The top 1% of incomes. Poor people having more kids doesn't change how many people comprise the 1% of
incomes.
And people might inherit wealth but they don't inherit incomes. So the top 1% of incomes is taking home a larger percentage of the overall incomes. That means that the bottom 99% of incomes are not growing in line with the top 1% of incomes.
So, maybe this will make more sense to you if you transition to thinking about this in terms of what jobs pay. Because that's what the income inequality issue is actually discussing - what jobs pay.
The bottom 99% of income earners should make less money compared to the top 1% of income earners but the ratio should not swing dramatically unless the jobs at the bottom have failed to increase in pay to the bottom 99%.
That's a simple graph with a much shorter time period to illustrate the problem with pointing to birthrates. That's the top 400 earners. They are the ideal representatives of your rich people as a smaller portion of the population theory.
Notice that in 1992-1994, their income remained relatively flat ($50 Million/yr.). Then it started spiking. It increased by 500% in 20 years. That is not a factor of birth rates. The U.S. population did not increase anywhere near enough between 1992 and 2014 to explain why the incomes of the top 400 earners went up by a factor of 6.
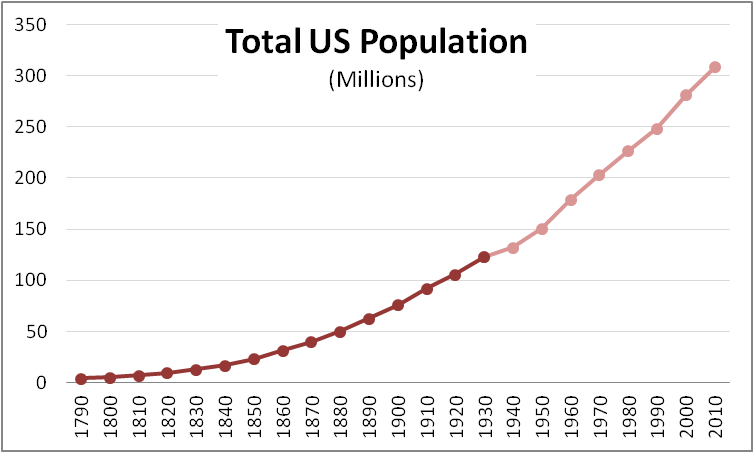
Ok now this:
Notice the peaks and valleys. If this was a product of birth rate differentials then you would expect a much smoother trend line because we haven't had corresponding population spikes and dips.
So, again -
Populations birth rate differentials don't matter because we are talking about incomes and incomes are the results of what jobs pay, not what people's parents earned 50 years ago. Jobs today vs. jobs tomorrow.
If birth rate differentials were influential, we would not see the top 400 earners have their income increase by 500% in 20 years without a corresponding population spike. There isn't one.
If birth rate differential were influential, we would not see spikes and dips in the top 1% earning rates without corresponding population spikes and dips. Again, there are no corresponding population fluctuations.
Your theory is bunk. The population changes and the incomes changes don't correspond with each other.