Interedasting....
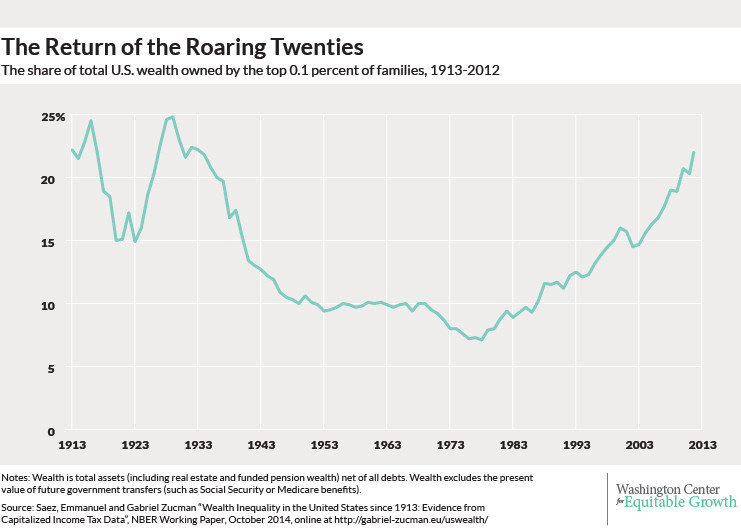
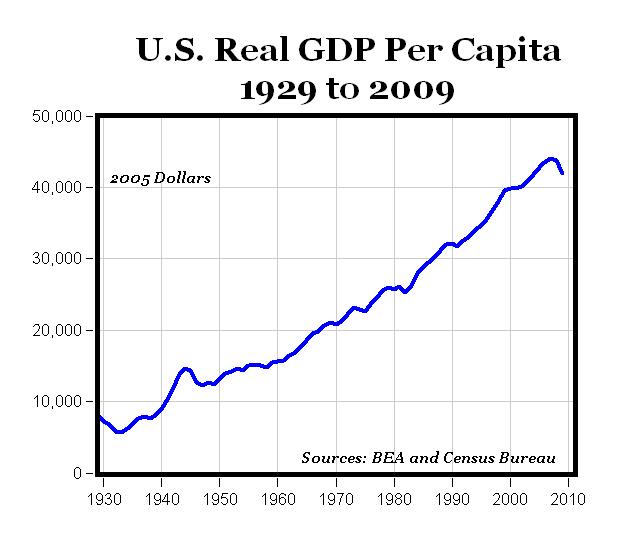
I would point out that despite increases in GDP per capita over the same period, every quintile in the US has seen their wages be relatively stagnant over the last 50 years, except the top 20%, Top 1%, and top .01%, don’t see how that is explained by baby boomers having kids. Point is average income per person has gone up but it has mostly accrued to the top. That is what is driving the wealth gap and it’s largely due to globalization, technology, and exacerbated by fiscal policy.
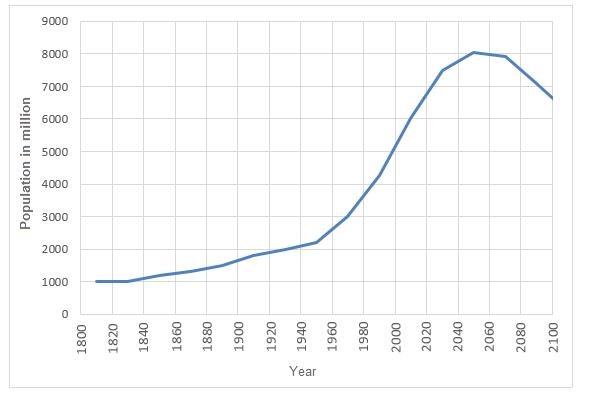
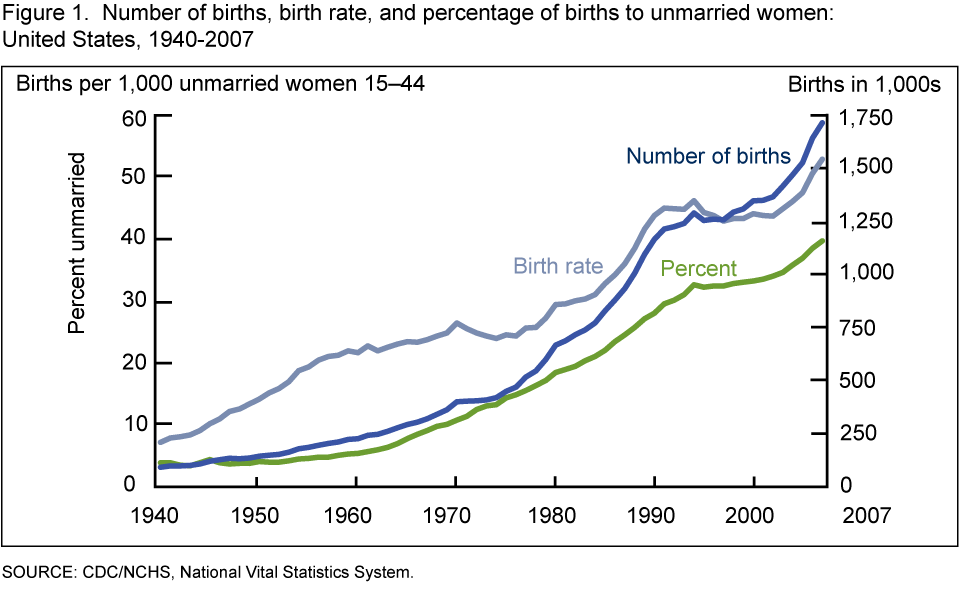
Not sure how having areas with more population growth with more insecurity correlates to a “kids” issue unless you can show that the number of kids per family is higher / causing that metric to actually go up over time. Even though overall family sizes are down in the USA, it might be a contributing factor in poorer urban areas, I would want to dig into that more. That still does not explain a 50 year trend over multiple quintiles imo.
Imo one of the best argument one could make from your population theme, and where I thought you might go, is that you need to strip out new arrivals that are weighing down the numbers. Population growth from immigration should increase hardship but if after a few generations it improves, things are working as intended.