
- Joined
- Nov 28, 2010
- Messages
- 20,615
- Reaction score
- 7,417
It's obvious that US police killings of suspects cannot be measured in 'normal' categories because there seems to be something fundamentally different. So I thought it might be nice to have some insight on where US police may be considered as especially out of control.
Obviously, this was inspired in part by this nice, civilized exchange:
So here is what I did in my lunch break. (Note: No, this is not the most scientific approach to this, sure.)
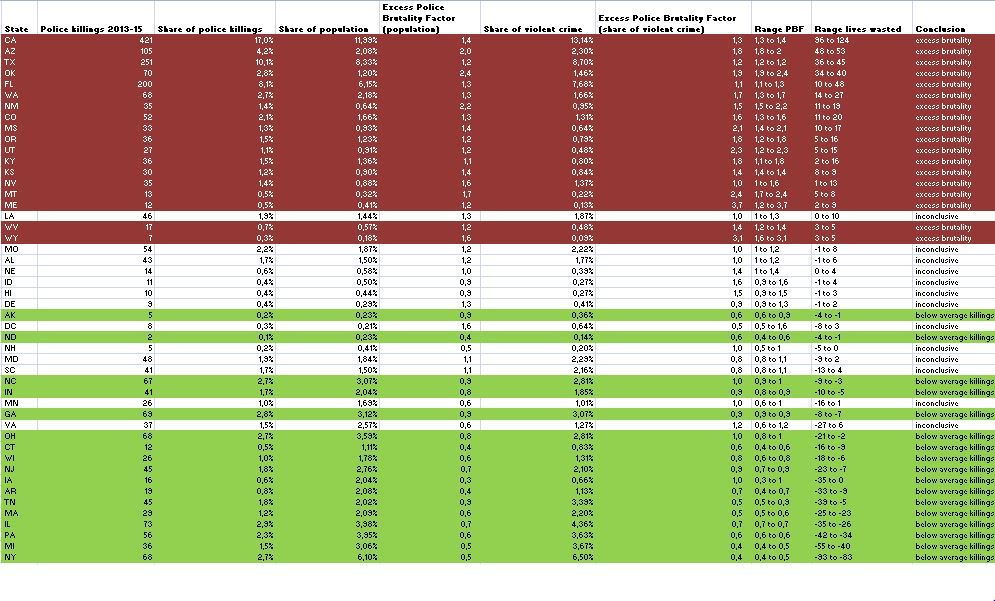
I used data from www.killedbypolice.net to count police killings by state 2013-2015. From that, I calculated the share of police killings in percent.
Then I checked what the population share is (i.e.: which share of police killings would you expect based on population?) and calculated what I called an Excess Police Brutality Factor. For example, if your state's share in police killings is 10%, but your population share is only 5%, then the "Excess Police Brutality Factor" would be 10% divided by 5% = 2, indicating there are 2x as many killings as you'd expect based on population. Conversely, if your state's share in police killings is 10%, but your population share is 20%, the factor would be 0.5, indicating that there are only half as many killings as you'd expect based on population.
Obviously, there may be other factors influencing the number of police killings. I thought that having a lot of violent crime should surely influence it. If there are a lot of hardened gang criminals, police will have to escalate violence more often. So I calculated the same thing as above based on FBI violent crime figures: What is the share of violent crimes committed in a specific state? And based on this, are there more or less police killings than we'd expect?
Based on this, I calculated a "Range of lives wasted". If the results of the two calculations from above are not conclusive - i.e., if one indicates there are less killings than you'd expect and the other one says there are more - I denoted that in the Conclusion column.
In total figures, California, Arizona, Texas and Oklahoma appear to be the most excessive. On the other end of the spectrum, you can see that - speaking strictly in terms of what's normal in US terms! - the NY police could kill dozens of people a year on top and would still not be excessive in national comparison.
Obviously, this was inspired in part by this nice, civilized exchange:
http://www.bbc.com/news/world-us-canada-33613783
The official version is that she hanged herself in her cell, but that seems odd given the circumstances.
This obviously happened in Texas.
Ur such a piece of shit. Have u killed any Jews today? U r German after all, right?
So here is what I did in my lunch break. (Note: No, this is not the most scientific approach to this, sure.)
I used data from www.killedbypolice.net to count police killings by state 2013-2015. From that, I calculated the share of police killings in percent.
Then I checked what the population share is (i.e.: which share of police killings would you expect based on population?) and calculated what I called an Excess Police Brutality Factor. For example, if your state's share in police killings is 10%, but your population share is only 5%, then the "Excess Police Brutality Factor" would be 10% divided by 5% = 2, indicating there are 2x as many killings as you'd expect based on population. Conversely, if your state's share in police killings is 10%, but your population share is 20%, the factor would be 0.5, indicating that there are only half as many killings as you'd expect based on population.
Obviously, there may be other factors influencing the number of police killings. I thought that having a lot of violent crime should surely influence it. If there are a lot of hardened gang criminals, police will have to escalate violence more often. So I calculated the same thing as above based on FBI violent crime figures: What is the share of violent crimes committed in a specific state? And based on this, are there more or less police killings than we'd expect?
Based on this, I calculated a "Range of lives wasted". If the results of the two calculations from above are not conclusive - i.e., if one indicates there are less killings than you'd expect and the other one says there are more - I denoted that in the Conclusion column.
In total figures, California, Arizona, Texas and Oklahoma appear to be the most excessive. On the other end of the spectrum, you can see that - speaking strictly in terms of what's normal in US terms! - the NY police could kill dozens of people a year on top and would still not be excessive in national comparison.