
- Joined
- Feb 28, 2016
- Messages
- 8,764
- Reaction score
- 4,425
Nice copy paste of bs. If you commit suicide and they find you hanging from a tree, it's a covid death. Hospitals get an extra $12k minimum for every one and doctors have complained about being pressured to list it as the cause. Of course, this is heavily censored by Google and the rest of the corrupt tech companies who rely on the CDC and the WHO, both of which are owned by the CCP, for their fake science and graphs that ignorant folks like to present online as indisputable 'facts'. There are also numerous doctors who have disputed the social distancing measures espoused by Fauci, who should be indicted btw, and they've all been censored. Play nice with the agenda to ultimately have us chipped and vaccinated or prepare to get done dirty.
[/QUOTE]This stupid idea being peddled on social media that regular flu deaths are being passed off as Covid-19 deaths and that Covid-19 is not causing any more deaths than normal is utter misinformation and has been debunked within numerous publications......... backed by solid research, plus linked and cross referenced. Basically not just an image from Facebook that any tom, dick or harry can throw up.
Please find an example below
UK figures
The claim that Covid-19 is not causing any more deaths than normal is based on two graphs, both of which appear to be lifted from a UK-based blog.
In a post on 1 April, the author shared a series of graphs (supplied to him by two contributors) to claim that an expected increase in deaths from Covid-19 in England and Wales had not yet materialised.
One graph – later shared on Facebook – attempts to show that the death rates among the “very old” in the UK (described as those aged 85 and over) are seasonal and vary significantly year to year.
It shows the total number of weekly deaths in the UK and Wales, stratified by age group, between 2010 and 2020.
Lines representing 2020 are also highlighted, showing that the number of deaths in each age group was not higher than in previous years.

According to the author of the blog, the graph shows that “there is no sign whatsoever of a killer in that data” and that “it’s a perfectly normal year.”
The data in the graph was sourced from the Office for National Statistics (ONS), the UK’s equivalent to the Central Statistics Office.
And an examination of the relevant ONS data on deaths registered weekly in England and Wales does show that the graph is accurate: https://www.ons.gov.uk/peoplepopula...nalfiguresondeathsregisteredinenglandandwales
During the first twelve weeks of the year, the number of deaths in England and Wales was not a significant increase on the number of deaths over the same period from 2010 to 2019.
And it’s true that more people aged between 75-84 and over 85 have died in England and Wales in other years compared with this year.
As the graph shows, there were spikes in weeks 2 to 5 among both age groups in 2015, and a similar spike among the over 85s during the same period in 2018.
Impact of Covid-19
When it comes to the Covid-19 pandemic, the graph doesn’t quite tell the full story.
The first case of Covid-19 in the UK was confirmed on 31 January, and the first death wasn’t confirmed until 5 March – the 10th week of 2020.
That means that any impact of Covid-19 on the number of deaths in 2020 would only be seen in the 10th, 11th and 12th weeks, when four, 35 and 374 deaths were recorded respectively.
But such relatively small numbers wouldn’t impact on a graph showing all weekly deaths across England and Wales.
That’s because that graph contains statistics from pretty much every other possible form of death (such as cancer and heart attacks).
For context, between 2011 and 2019, the average number of deaths from all causes during week 10 in the UK and Wales was 10,845.
During week 11, the average number of deaths from all causes over the 9-year period was 10,680; and in week 12 it was 10,290.
It was only in weeks 13 and 14 when the number of Covid-19 deaths began to significantly increase in the UK, that the impact of the coronavirus on death statistics became apparent.
Here’s a graph showing the total number of deaths from weeks 1 to 14, covering 2010 to 2020:
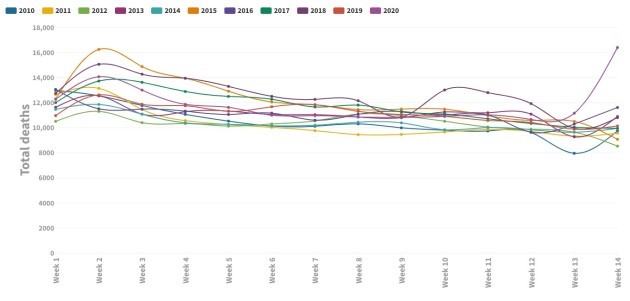
Note the jump at the very end, representing weeks 13 and 14 in 2020.
In fact, the total number of deaths in week 14 this year was higher than in any other week from January to April since the beginning of 2010.
It’s worth pointing out that the number of deaths in the UK is continuing to rise, and could be even higher if restrictions on movement and gatherings were not introduced there last month.
It’s true that the number of deaths at the peak of this year’s flu season, which usually happens between December and February in England and Wales, was not higher than in other years.
And it may have been accurate to say “it’s a perfectly normal year” in week 12, when the coronavirus didn’t have an impact.
But Covid-19 began to have an impact on death statistics as the flu season came to an end, and recent data shows that 2020 is anything but a normal year.
Deaths from respiratory causes
Meanwhile, a second graph shared on the blog (and subsequently on Facebook) suggests that the total number of deaths in England and Wales from respiratory diseases was below average during the first 12 weeks of the year.
It claims that there were 3,334 fewer deaths in the first 12 weeks of 2020, compared with the average number of deaths over the same period from 2015 to 2019. Here it is:
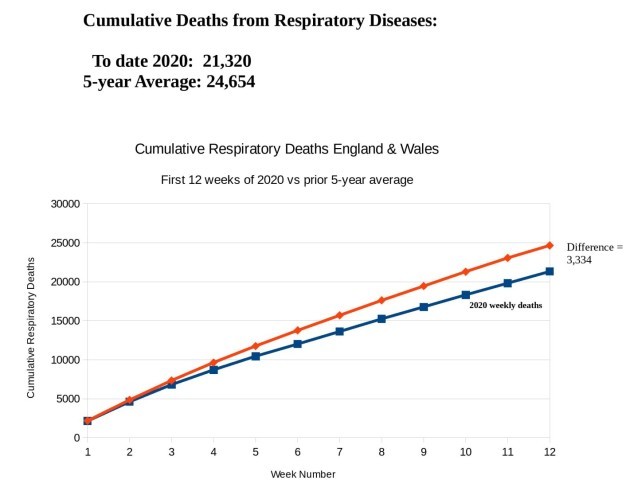
Once again, the data is sourced from ONS figures on deaths registered weekly in England and Wales.
A look at the data on the ONS website shows that the figures in the graph are inaccurate: the total number of deaths this year was actually 21,781 – not 21,320.
It’s a small difference, and the discrepancy may be down to the ONS updating its statistics in the weeks since the original graph was made.
Despite this, the 2020 figure was still almost 3,000 deaths below the five-year average from 2015 to 2019. But as we’ve already mentioned, a different picture emerged in weeks 13 and 14.
When data for these two weeks is included, the total number of deaths from respiratory causes in 2020 jumped to 31,246. That compares with an average of 27,444 deaths over the same period from 2015 to 2019.
Here’s what the graph above would look like with weeks 13 and 14 from this year were included:
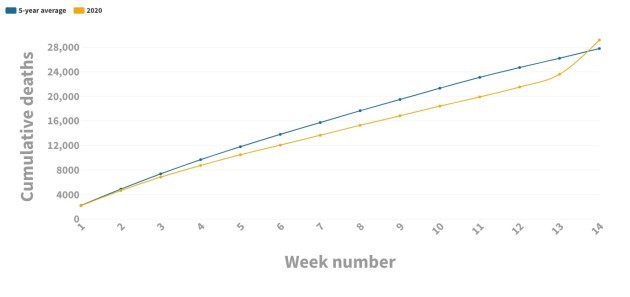
As the graph shows, the number of cumulative deaths from respiratory illnesses in England and Wales is actually an increase on the average figure for the previous five years.
Therefore, the claim on Facebook that Covid-19 is not causing any more deaths in England and Wales than usual is not true.
Also it goes without saying that we have still not even experienced all the covid deaths in 2020. We are still just in the first week of November 2020.


